
Because price lies, but volume doesn’t.
Presenting Volume Trend 2.0 🧠📈
This indicator not only tells you what to buy – but also when!
It filters noise, tracks smart money, and keeps you aligned with market momentum.
🧠 What It Does
This isn’t a random signal generator.
It’s a smart context tool that reads market mood, momentum strength intent & stock behavior together — so you know when to attack and when to wait.
It blends 3 core engines:
1. Volume Flow Engine – tells whether buyers or sellers are dominating. Traditional volume bars do not tell whole story.
2. Smart Money Mood Engine – reads Smart Money’s mood on the broader market.
3. Free-Float Insight – tells how much of the stock is actively tradable (helps identify stocks with sharp moves).
🎯 Decision Guide (Color & Signal Meanings)
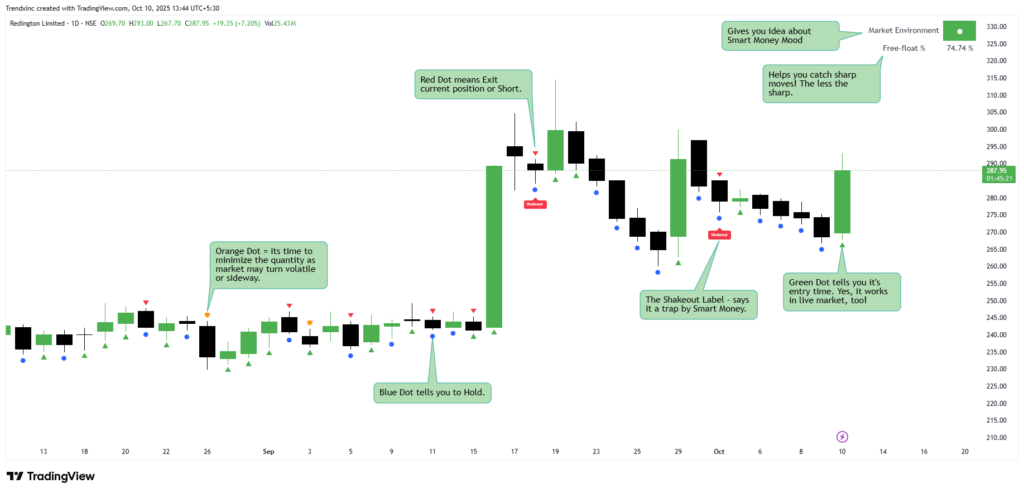
1. 🟩 Green Triangle (Potential Entry Signal)
→ Appears below the candle.
→ Buyers dominating volume.
✅ Indicates accumulation or strong buying interest.
👉 Consider adding on strength or wait for breakout continuation.
2. 🔵Blue Dot (Hold Signal)
→ Appears below bar when momentum is weak but still positive.
✅ Suggests buyers are cooling off but not exiting.
👉 Hold positions; avoid panic exits.
3. 🔻Red Triangle (Sell Signal)
→ Appears above candle.
⚠️ Indicates strong distribution or short setup.
👉 Ideal for booking profits or shorting on pullback.
4. 🟠Orange Circle (Decrease Position)
→ Appears above bar when momentum is weak but not collapsing.
⚠️ Trend is up but momentum fading.
👉 Reduce exposure; partial booking advised.
5. 🔖“Shakeout” Label
→ Shows when price fakes a breakdown but volume suggests smart buying.
✅ Indicates possible trap for retailers.
👉 Wait for confirmation candle; often marks short-term bottoms.
🌍 Market Environment Color (Top-Right Dot)
🟢 Green Dot
– Sentiment is Super Bullish
– Intraday and Swing, both setups will work fine
🟠 Orange Dot
– Pullback. Weak but not bearish
– Intraday will work but not good for holding. At the end of the day stocks will fall back
🔴 Red Dot
– Strong Bearish or Consolidation
– Worst Environment for Intraday or Swing
– Sit on Cash and wait till it again becomes Orange or Green
📊 Free Float % (Positioned Below Environment Section)
Shows how much of total shares are freely available for trading.
– Low Free Float → explosive price swings (smart money playground)
– High Free Float → smoother trends, slower moves
📈How To Use It Together
📝 Combine market environment + volume context.
✅ When Market = Green & Volume = Green → high-probability long setups.
✅ When Market = Red & Red signals trigger → short with confidence.
✅ When Orange or Blue appear → stay defensive or trade half size.
New update release for our Volume Trend Indicator 🎉
What’s new?
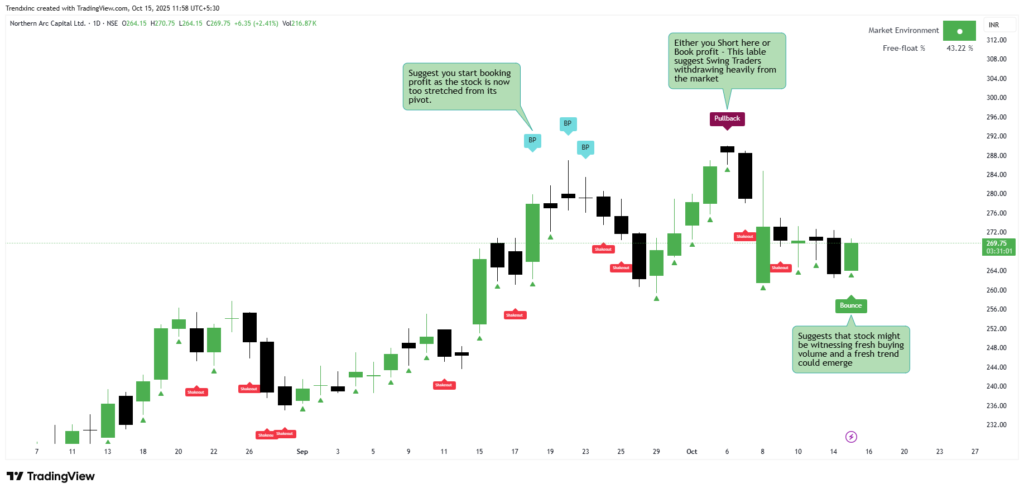
1. Added signals for buying/holding, and strategic labels like “Bounce”, “Pullback”, “Shakeout”, and “Book Profit (That Sky blue label with “BP” written in it.)”
#Shekeout – This signals potential “fakeouts” where weak hands are shaken out, often in uptrends. It’s a contrarian hint that the drop might be temporary, especially if the market environment is green.
Action – If you see “Shakeout” near support or after a rally, consider it a buying opportunity. Avoid shorting here—wait for confirmation. In the screenshot, multiple “Shakeout” labels precede bounces, suggesting accumulation.
#Pullback – Signals a possible downturn after a stretched intraday/swing levels and weakening momentum.
Action – Consider booking profit if you are doing Swing or Intraday. “Pullback” warns of sellers gaining control (e.g., profit-taking).
#Bounce – Indicates a potential reversal upward after structural break (Liquidity Grab) and momentum gaining underneath strength
Action – A “Bounce” follows “Shakeout”, marking a trend resumption. Look to buy or add to longs, especially if you see Blue Dot or green Triangle on a Green candle.
#Book_Profit (The Sky Blue Label) – Appear when price is too stretched from its trend pivot.
Action – Often a bearish reversal signal. However, on stronger charts you will see that even after their appearance price went up significantly. So the best idea is to keep trailing your SLs to these candles’ low instead of immediate exit.
2. Enhanced Labels with On/Off Toggle: You can now customize visibility for “Bounce”, “Pullback”, “Shakeout”, and “BOOK PROFIT” labels directly from the indicator settings. This lets you declutter your chart while focusing on what matters to your strategy.
3. Best Practices: Test on historical data (backtest via TradingView). Works best on uptrending stocks like the one in the screenshot, where “Shakeout” to “Bounce” sequences signal fresh trends.
4. Limitation – It can lag in low-liquidity stocks.
If you have feedback or spot issues, drop a comment! Happy trading—may your trading portfolio be green, every single day! 📈
Read the Full Guide here – https://x.com/trendxinc/status/1976582583543586873
Price – Rs. 9999/-
Validity – 6 Months